An IR spectrum can be visualized in a graph of infrared light absorbance (or transmittance) on the vertical axis vs. frequency or wavelength on the horizontal axis. Typical units of frequency used in IR spectra are reciprocal centimeters (sometimes called wave numbers), with the symbol cm−1. Units of IR wavelength are commonly given in micrometers (formerly called "microns"), symbol μm, which are related to wave numbers in a reciprocal way. A common laboratory instrument that uses this technique is a Fourier transform infrared (FTIR) spectrometer. Two-dimensional IR is also possible as discussed below.
The infrared portion of the electromagnetic spectrum is usually divided into three regions; the near-, mid- and far- infrared, named for their relation to the visible spectrum. The higher-energy near-IR, approximately 14000–4000 cm−1 (0.7–2.5 μm wavelength) can excite overtone or harmonic molecular vibrations. The mid-infrared, approximately 4000–400 cm−1 (2.5–25 μm) may be used to study the fundamental vibrations and associated rotational-vibrational structure. The far-infrared, approximately 400–10 cm−1(25–1000 μm), lying adjacent to the microwave region, has low energy and may be used for rotational spectroscopy. The names and classifications of these subregions are conventions, and are only loosely based on the relative molecular or electromagnetic properties.
The infrared spectrum of a sample is recorded by passing a beam of infrared light through the sample. When the frequency of the IR is the same as the vibrational frequency of a bond or collection of bonds, absorption occurs. Examination of the transmitted light reveals how much energy was absorbed at each frequency (or wavelength). This measurement can be achieved by scanning the wavelength range using a monochromator. Alternatively, the entire wavelength range is measured using a Fourier transform instrument and then a transmittance or absorbance spectrum is generated using a dedicated procedure.
This technique is commonly used for analyzing samples with covalent bonds. Simple spectra are obtained from samples with few IR active bonds and high levels of purity. More complex molecular structures lead to more absorption bands and more complex spectra.

Typical IR solution cell. The windows are CaF2.
Sample preparationEdit
Gaseous samples require a sample cell with a long pathlength to compensate for the diluteness. The pathlength of the sample cell depends on the concentration of the compound of interest. A simple glass tube with length of 5 to 10 cm equipped with infrared-transparent windows at the both ends of the tube can be used for concentrations down to several hundred ppm. Sample gas concentrations well below ppm can be measured with a White's cell in which the infrared light is guided with mirrors to travel through the gas. White's cells are available with optical pathlength starting from 0.5 m up to hundred meters.
Liquid samples can be sandwiched between two plates of a salt (commonly sodium chloride, or common salt, although a number of other salts such as potassium bromide or calcium fluoride are also used).[2] The plates are transparent to the infrared light and do not introduce any lines onto the spectra.
Solid samples can be prepared in a variety of ways. One common method is to crush the sample with an oily mulling agent (usually mineral oil Nujol). A thin film of the mull is applied onto salt plates and measured. The second method is to grind a quantity of the sample with a specially purified salt (usually potassium bromide) finely (to remove scattering effects from large crystals). This powder mixture is then pressed in a mechanical press to form a translucent pellet through which the beam of the spectrometer can pass.[2] A third technique is the "cast film" technique, which is used mainly for polymeric materials. The sample is first dissolved in a suitable, non hygroscopic solvent. A drop of this solution is deposited on surface of KBr or NaCl cell. The solution is then evaporated to dryness and the film formed on the cell is analysed directly. Care is important to ensure that the film is not too thick otherwise light cannot pass through. This technique is suitable for qualitative analysis. The final method is to use microtomy to cut a thin (20–100 μm) film from a solid sample. This is one of the most important ways of analysing failed plastic products for example because the integrity of the solid is preserved.
In photoacoustic spectroscopy the need for sample treatment is minimal. The sample, liquid or solid, is placed into the sample cup which is inserted into the photoacoustic cell which is then sealed for the measurement. The sample may be one solid piece, powder or basically in any form for the measurement. For example, a piece of rock can be inserted into the sample cup and the spectrum measured from it.
Comparing to a referenceEdit

Schematics of a two-beam absorption spectrometer. A beam of infrared light is produced, passed through an
interferometer (not shown), and then split into two separate beams. One is passed through the sample, the other passed through a reference. The beams are both reflected back towards a detector, however first they pass through a splitter, which quickly alternates which of the two beams enters the detector. The two signals are then compared and a printout is obtained. This "two-beam" setup gives accurate spectra even if the intensity of the light source drifts over time.
It is typical to record spectrum of both the sample and a "reference". This step controls for a number of variables, e.g. infrared detector, which may affect the spectrum. The reference measurement makes it possible to eliminate the instrument influence.
The appropriate "reference" depends on the measurement and its goal. The simplest reference measurement is to simply remove the sample (replacing it by air). However, sometimes a different reference is more useful. For example, if the sample is a dilute solute dissolved in water in a beaker, then a good reference measurement might be to measure pure water in the same beaker. Then the reference measurement would cancel out not only all the instrumental properties (like what light source is used), but also the light-absorbing and light-reflecting properties of the water and beaker, and the final result would just show the properties of the solute (at least approximately).
A common way to compare to a reference is sequentially: first measure the reference, then replace the reference by the sample and measure the sample. This technique is not perfectly reliable; if the infrared lamp is a bit brighter during the reference measurement, then a bit dimmer during the sample measurement, the measurement will be distorted. More elaborate methods, such as a "two-beam" setup (see figure), can correct for these types of effects to give very accurate results. The Standard addition method can be used to statistically cancel these errors.
Nevertheless, among different absorption based techniques which are used for gaseous species detection, Cavity ring-down spectroscopy (CRDS) can be used as a calibration free method. The fact that CRDS is based on the measurements of photon life-times (and not the laser intensity) makes it needless for any calibration and comparison with a reference [3]
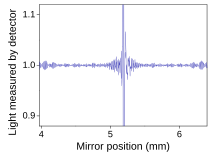
An interferogram from an
FTIRmeasurement. The horizontal axis is the position of the mirror, and the vertical axis is the amount of light detected. This is the "raw data" which can be
Fourier transformed to get the actual spectrum.
Fourier transform infrared (FTIR) spectroscopy is a measurement technique that allows one to record infrared spectra. Infrared light is guided through an interferometer and then through the sample (or vice versa). A moving mirror inside the apparatus alters the distribution of infrared light that passes through the interferometer. The signal directly recorded, called an "interferogram", represents light output as a function of mirror position. A data-processing technique called Fourier transform turns this raw data into the desired result (the sample's spectrum): Light output as a function of infrared wavelength (or equivalently, wavenumber). As described above, the sample's spectrum is always compared to a reference.
An alternate method for acquiring spectra is the "dispersive" or "scanning monochromator" method. In this approach, the sample is irradiated sequentially with various single wavelengths. The dispersive method is more common in UV-Vis spectroscopy, but is less practical in the infrared than the FTIR method. One reason that FTIR is favored is called "Fellgett's advantage" or the "multiplex advantage": The information at all frequencies is collected simultaneously, improving both speed and signal-to-noise ratio. Another is called "Jacquinot's Throughput Advantage": A dispersive measurement requires detecting much lower light levels than an FTIR measurement.[4] There are other advantages, as well as some disadvantages,[4] but virtually all modern infrared spectrometers are FTIR instruments.
Ultrahigh energy resolution EELSEdit
Ultrahigh energy resolution electron energy loss spectroscopy (EELS) has recently emerged as a new technique for performing infrared spectroscopy in the transmission electron microscope (TEM).[5] In combination with the high spatial resolution of the TEM, unprecedented experiments have been performed, such as nano-scale temperature measurements,[6][7] mapping of isotopically labeled molecules,[8] mapping of phonon modes in position- and momentum-space,[9][10] vibrational surface and bulk mode mapping on nanocubes,[11] or investigations of polariton modes in van der Waals crystals.[12] Analysis of vibrational modes that are IR-inactive but appear in Inelastic Neutron Scattering is also possible at high spatial resolution using EELS.[13]


Comments
Post a Comment